According to the study titled Moving to Universal Coverage? Trends in the Burden of Out-Of-Pocket Payments for Health Care across Social Groups in India, 1999-2000 to 2011-12 by Anup Karan, Sakthivel Selvaraj and Ajay Mahal, Plos One Journal, August 15, 2014 (please click here to access): • The study has found rising share of out-of-pocket health expenditure in total…
Read MoreBased on data and knowledge resources available in the public domain, India Exclusion Report 2013-14 highlights the systematic discrimination faced by women, Scheduled Castes (SCs), Scheduled Tribes (STs), Muslims, persons with disabilities and the sexual minorities (LGBT) in accessing the public goods and services. As per the India Exclusion Report 2013-14, which has been prepared by Centre…
Read MoreAs per the article entitled: Conditions of SC/ST Households: A Story of Unequal Improvement by RB Bhagat (2013), Economic and Political Weekly, October 12, Vol. XLVIII, No. 41, page no. 62-66 (please click here to access): • Although 21.9 percent Schedules Caste (SC) households live in houses having concrete roofs, only 10.1 percent Schedules tribe (ST) households live…
Read MoreAccording to Tribal Profile at a Glance (May 2013), prepared by Ministry of Tribal Affairs, Government of India (please click here to download): • The percentage of Schedules Tribes (STs) to total population has increased from 8.2 percent in 2001 to 8.6 percent in 2011 (based on Census 2001 and 2011). • The sex ratio (i.e. number of…
Read More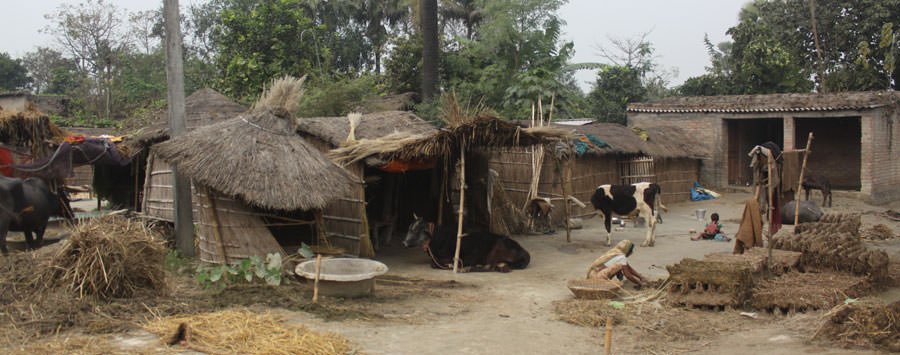
Output and Growth According to the Economic Survey 2017-18, Volume-2 (please click here to access): • The growth rates of agriculture & allied sectors have been fluctuating at 1.5 per cent in 2012-13, 5.6 per cent in 2013-14, (-) 0.2 per cent in 2014-15, 0.7 per cent in 2015-16 and 4.9 per cent in 2016-17. • The Gross Capital…
Read More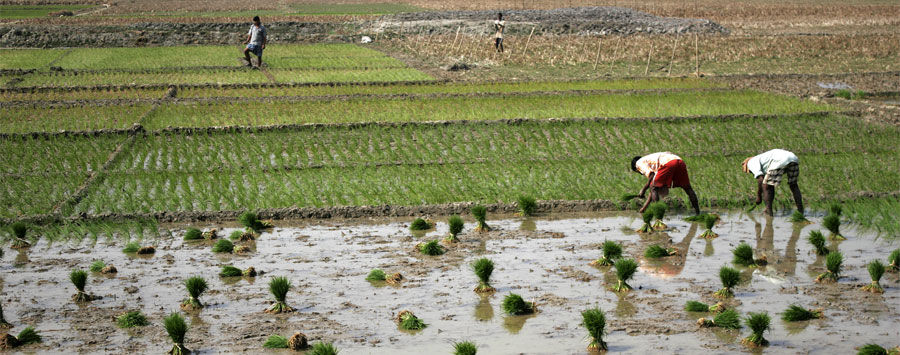
KEY TRENDS • The NSS 59th Round (January-December 2003) had found that 48.6% farmerhouseholds were indebted while the NSS 70th Round (January-December 2013) has observed that 52% of India’s agricultural households were indebted in July, 2012-June, 2013 $ • A similar survey on rural indebtedness by the NSSO in 1991 found indebtedness among only 26%…
Read More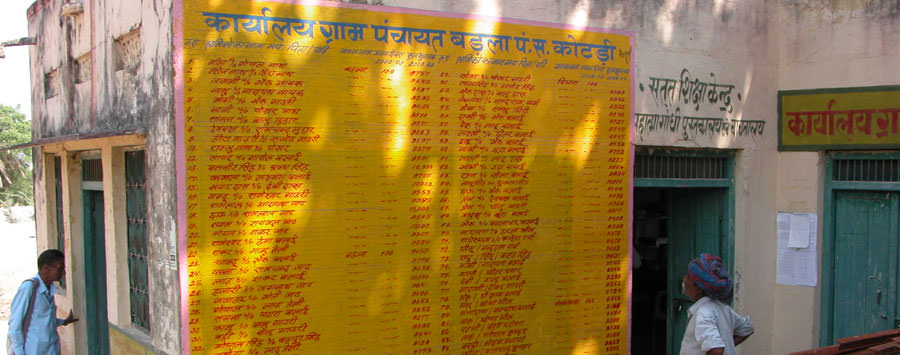
KEY TRENDS • A total of 7.55 lakh (755,247) RTI applications were received by the reporting public authorities in 2014-15. This is about 79,000 fewer RTI applications received in 2013-14. The CIC report notes this decline in the number of RTIs received. However almost 90,000 RTI applications were pending decision at the start of the…
Read More
Kindly click here and here to access the key findings of the Report Card on the Performance of Information Commissions in India 2021-22 (released in October, 2022) that has been prepared by Satark Nagrik Sangathan. — Please click here to access the key findings of the Report Card on the Performance of Information Commissions in India, 2021 (released in October, 2021), which has been prepared…
Read More
As per the Rapid Review 4.0 (previously named Rapid Study) of the State of Information Commissions and Use of RTI Laws across India (released in March 2018), which was prepared by the Commonwelath Human Rights Initiative (CHRI), please click here to access: State of Information Commissions • Headless and non-existent SICs: There is no State Chief Information Commissioner (SCIC)…
Read More