The Performance Audit of the implementation of NREGA by the Comptroller and Auditor General of India, cag.gov.in/html/reports/civil/2008_PA11_nregacivil/Exe-sum.pdf show: • A Performance Audit of the implementation of NREGA in the initially notified 200 districts was taken up during May–September 2007, in response to a request from the Ministry of Rural Development, so as to provide assurance that the processes…
Read More
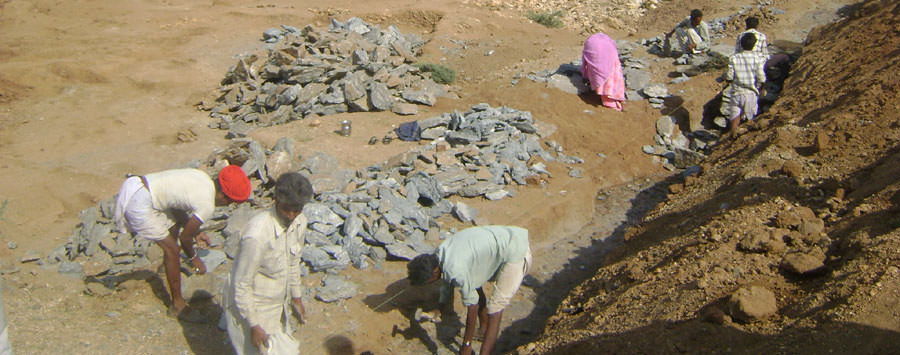
Best Practices on Financial Inclusion in NREGA Source: Chapter 1: NREG Scheme, page 10, Annual Report 2007-08, Ministry of Rural Development, Government of India Gulbarga District – Karnataka The district has a population of 31.30 lakhs. There are 337 gram panchayts and 1363 villages. The total number of households is 3.89 lakhs out of which…
Read More
KEY TRENDS • According to the CMS-India Corruption Study 2018, among states, 73 percent households in Telangana, 38 percent in Tamil Nadu, 36 percent in Karnataka, 35 percent in Bihar, 29 percent in Delhi, 23 percent in Madhya Pradesh; 22 percent in Punjab and 20 percent households in Rajasthan experienced demand for bribe or had to use…
Read More
Kindly click here to access the document titled Overview of corruption and anticorruption developments in India (released in January 2022), which has been prepared by Kaunain Rahman of Transparency International. The main points of the document are: • Corruption remains an endemic problem for India, pervading all levels of governance.• The violation of human rights in the Indian…
Read More
According to the CMS-India Corruption Study 2018: 2015 to 2018-How well are states placed? please click here to access: • The CMS-ICS 2018 has covered both rural and urban locations of 13 states and 11 public services. • The present report finds that 75 percent households have the perception that the level of corruption in public services has either…
Read More
According to the CMS-India Corruption Study 2017: Perception and Experience with Public Services & Snapshot View for 2005-17, please click here to access: • Between 2005 and 2017, there is a definite decline in both perception and experience of citizens about corruption in availing public services. • The 11th round of annual CMS-ICS 2017 brings out that nearly…
Read More
The Corruption Perceptions Index is based on expert opinions of public sector corruption. Countries’ scores can be helped by open government where the public can hold leaders to account, while a poor score [on a scale from 0 (perceived to be highly corrupt) to 100 (perceived to be very clean)] is a sign of prevalent…
Read More
According to the report titled: Corruption Perceptions Index 2013 by Transparency International, http://cpi.transparency.org/cpi2013/press/ http://cpi.transparency.org/cpi2013/results/: • India’s score stands at 36, the same as it was in 2012. It is among majority of the 177 countries in 2013 having index score below 50, on a scale from 0 (perceived to be highly corrupt) to 100 (perceived to be…
Read More
According to the Global Corruption Barometer 2013 prepared by Transparency International, http://www.transparency.org/gcb2013/report http://www.transparency.org/gcb2013/country/?country=india: • 54 percent of respondents from India reported having paid a bribe in the last 12 months to one out of eight services-police, judiciary, registry, land, medical, education, tax and utilities. • 40 percent of respondents from India felt that over the past 2 years…
Read More